Pareto Optimal
1. What is Pareto Optimal
Pareto Optimality is the concept where in a set of data points, it is all of the data points that are unique, or has value that can not be replaced or substituted for. For example in the set (2,2), (4,4), (6,1), (5,2), (2,5), (3, 6). The pareto optimal points are (4,4), (6,1), (5,2), and (3,6). (2,2) is taken out because it is not efficient to keep it since (4,4) has the values of (2,2) within it as well as more values. (2,5) is similarly taken out because the values within (2,5) is contained within the values of (3,6).

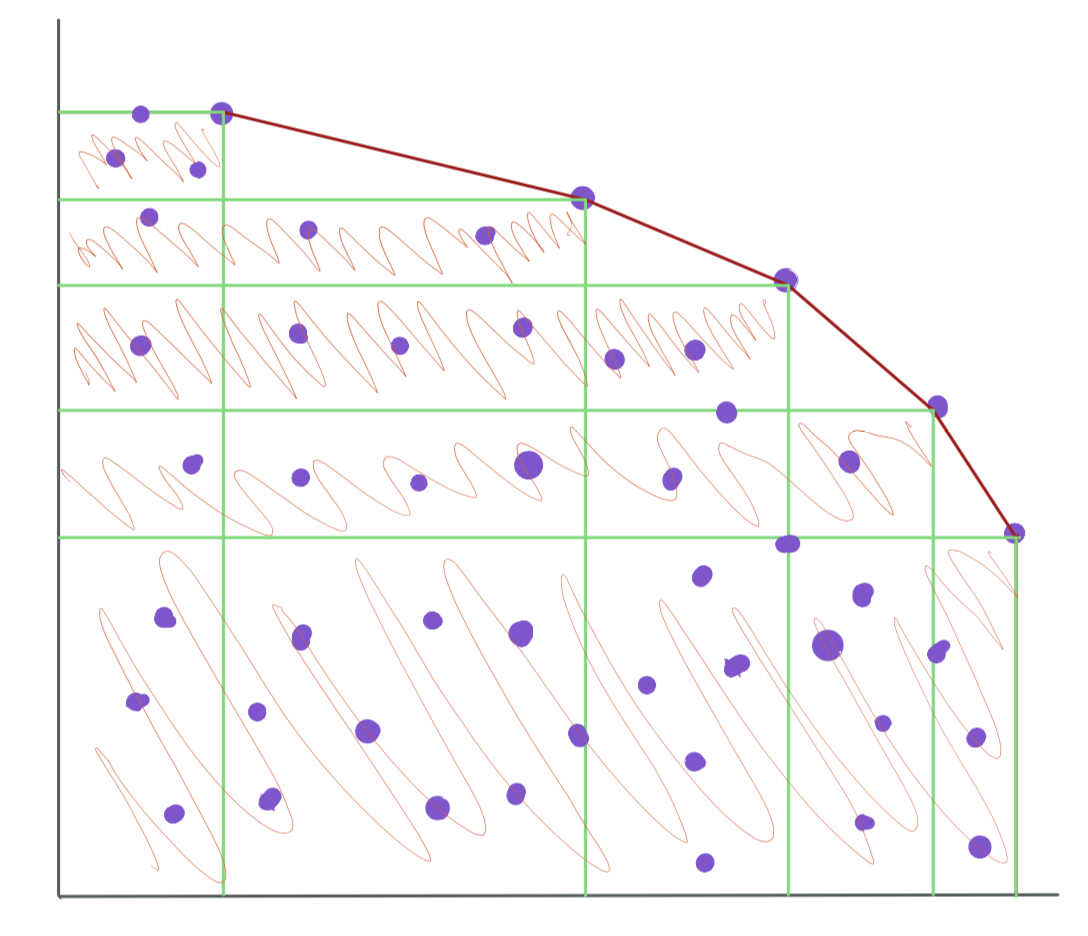
The five outer most points and the ones connected by the red-lines, are the pareto optimal points of the set of points. The green lines coming from the pareto points indicates th region of points that is covered by each respective pareto point. The orange lines is to help show the area that is covered by the pareto points. Basically anything in the orange region (or within the green lines) are points that will be removed from the data set because their values are being covered within the pareto points.
2. Creating Pareto Function
The pareto function is pretty neat because it shows the most unique points. I thought it would be even cooler if I could make get pareto points of NBA players based off of their stats. In order to do so, I was going to need to create a pareto functoin.

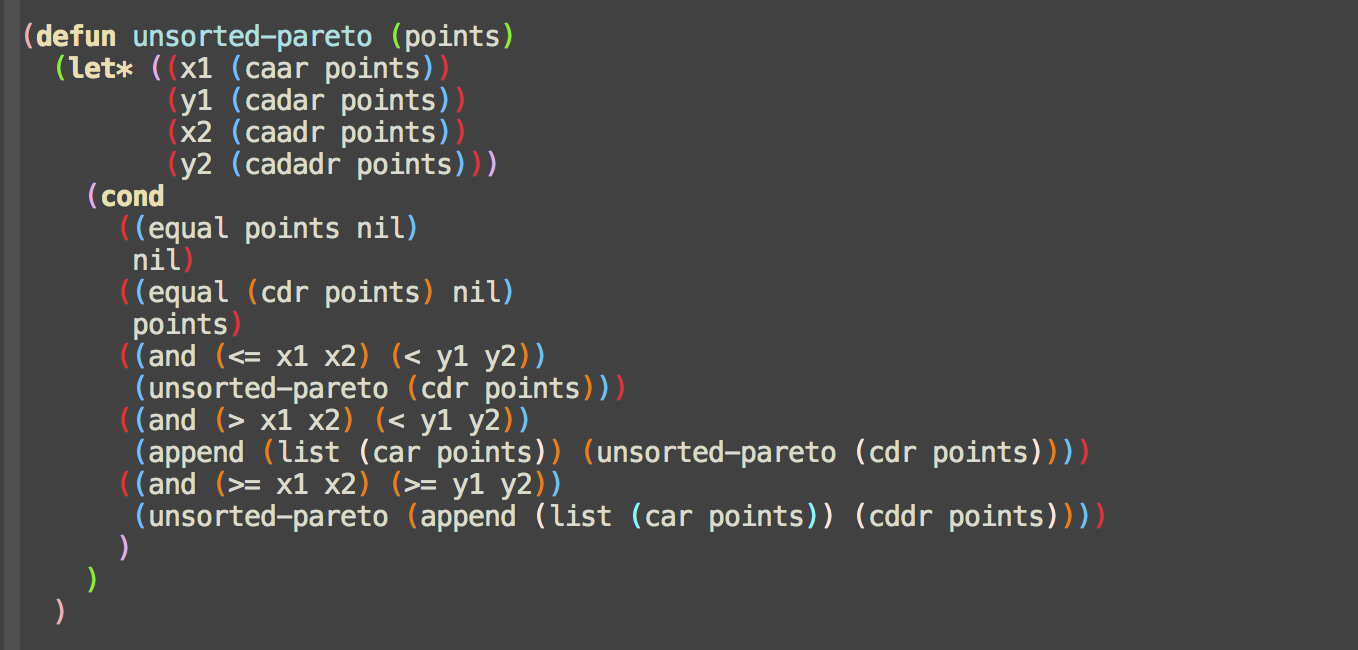
The pareto code works as a recursion function with essentialy 5
conditions that it follows. The first part
with let* is to set up the points that it will be
comparing. The first condition is that if there are no point
inputed, then it returns nil so recursion doesn't happen. The
second condition checks to see if there is more than one set of
points, if there isn't then the last point is pareto
optimal. Third condition compares the x and y of the two points
and if x1 <= x2 as well as y1 < y2, point one is not a
pareto point so recurse from the remaining points after point
one. Fourth condition is if x1 > x2 and y1 < y2, the point
is a pareto point so append it to result and again recurse from
the remaining points after the point one. Finall the fifth
condition, if x1 >= x2 and y1 >= y2, the second point is not
a pareto point but the first one still could be, so recurse the
function with the first point append to the list of points after
the second point. (note that the list of points should first be
sorted from the greatest to smallest based off either x or y).
3. End Result
Implimenting the pareto code into NBA stats, was not too difficult as most of the code stats the same except for how the stat points are found. After changing that in a new function specifically for NBA player stats, I was able to successfully implement a pareto optimality algorithm to find the pareto optimal players of two given stat categories. (Link to NBA pareto optimal stats page)

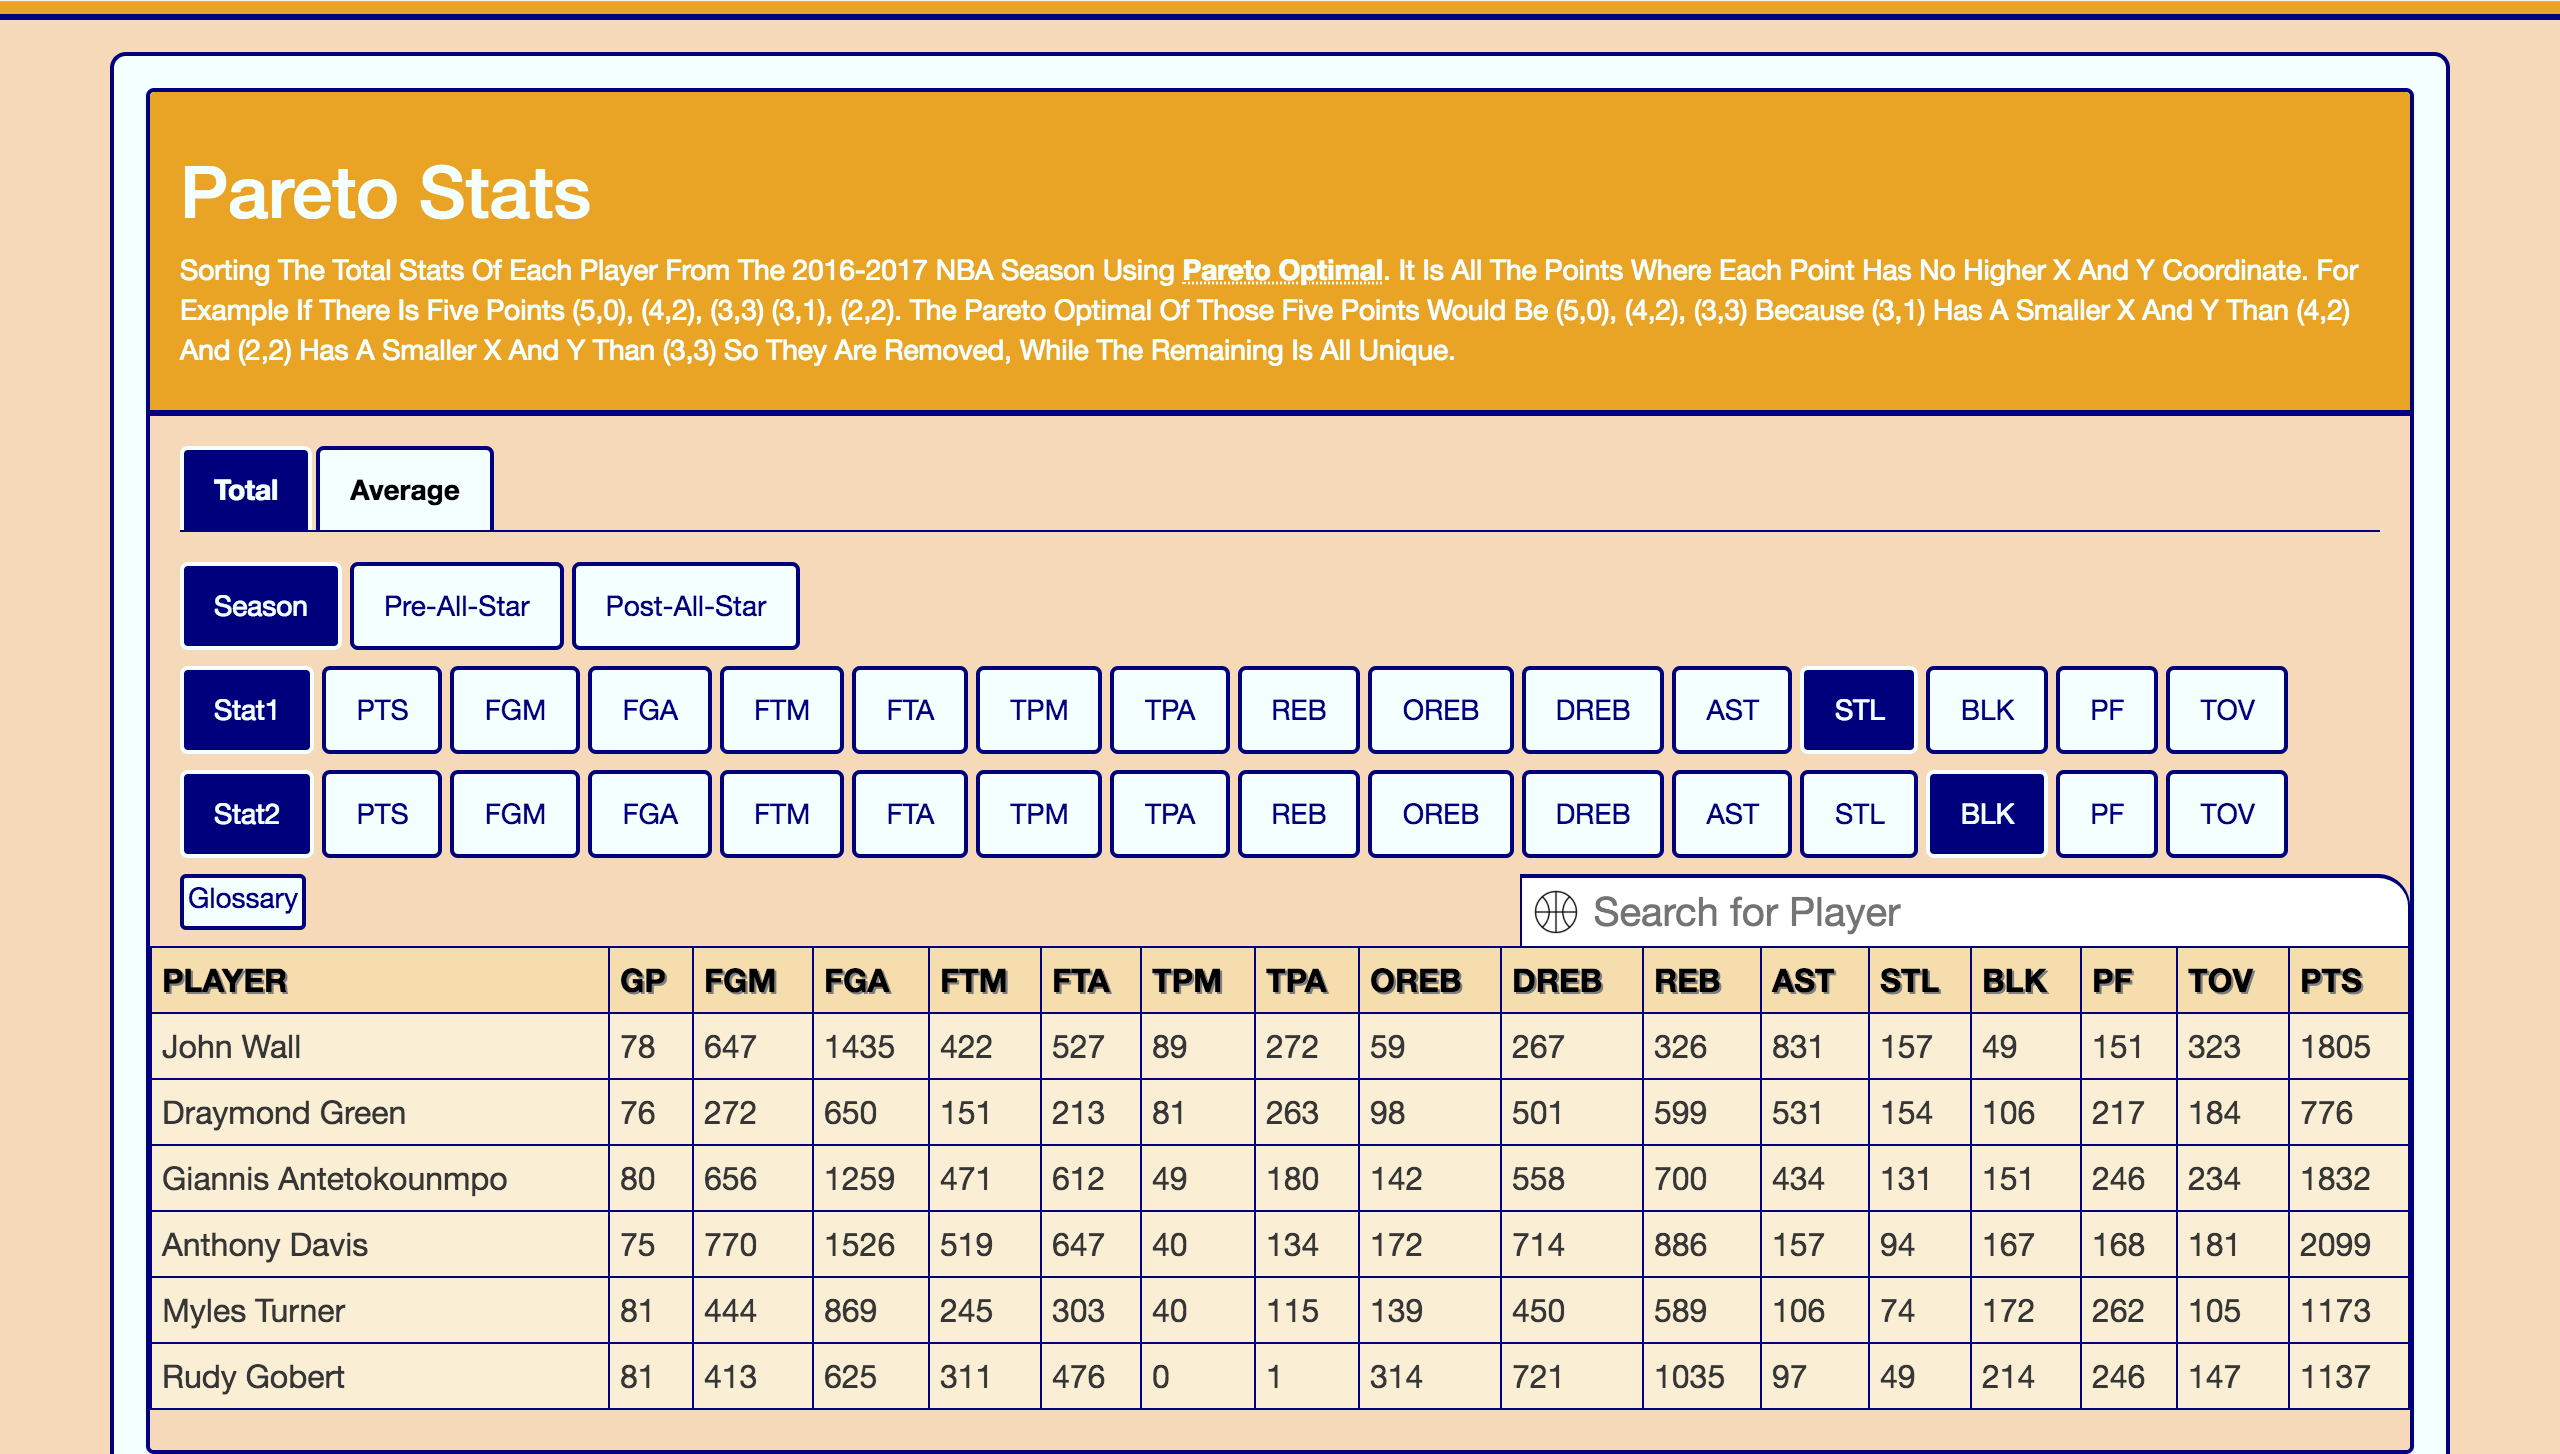
Testing out the pareto optimality page with the stat categories "STL" and "BLK" (steal and block respectively), I get six players. John Wall and Rudy Gobert are locks for the output since Wall is the NBA league leader in steals while Gobert led the NBA in blocks, so for sure nobody can replace them since they have unique values. Checking the other four players, they all have very impressive stats and none of them are contained by the other shown players so it is safe to assume that the players shown are the pareto optimal points for steals and blocks.